I thought the daily mood was helpful but didn't like the way it spaced data points in the readout.
So being a math nut I designed a three dimensional, non Euclidian graphing system to track my moods.
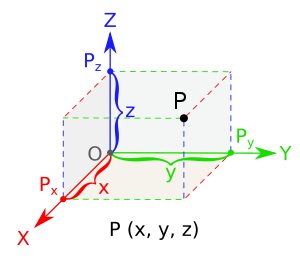
Basically it used 3 axis, (see figure A) with one (Y) representing the date, one (Z) representing Mania/depression and one (positive X values) representing mixed states
It worked well but took quite a bit of explaining before the shrink got the hang of reading it.

Figure A
(After though; You know this post looks Creeply like an excerpt from my maths textbook)